Goal dashboard
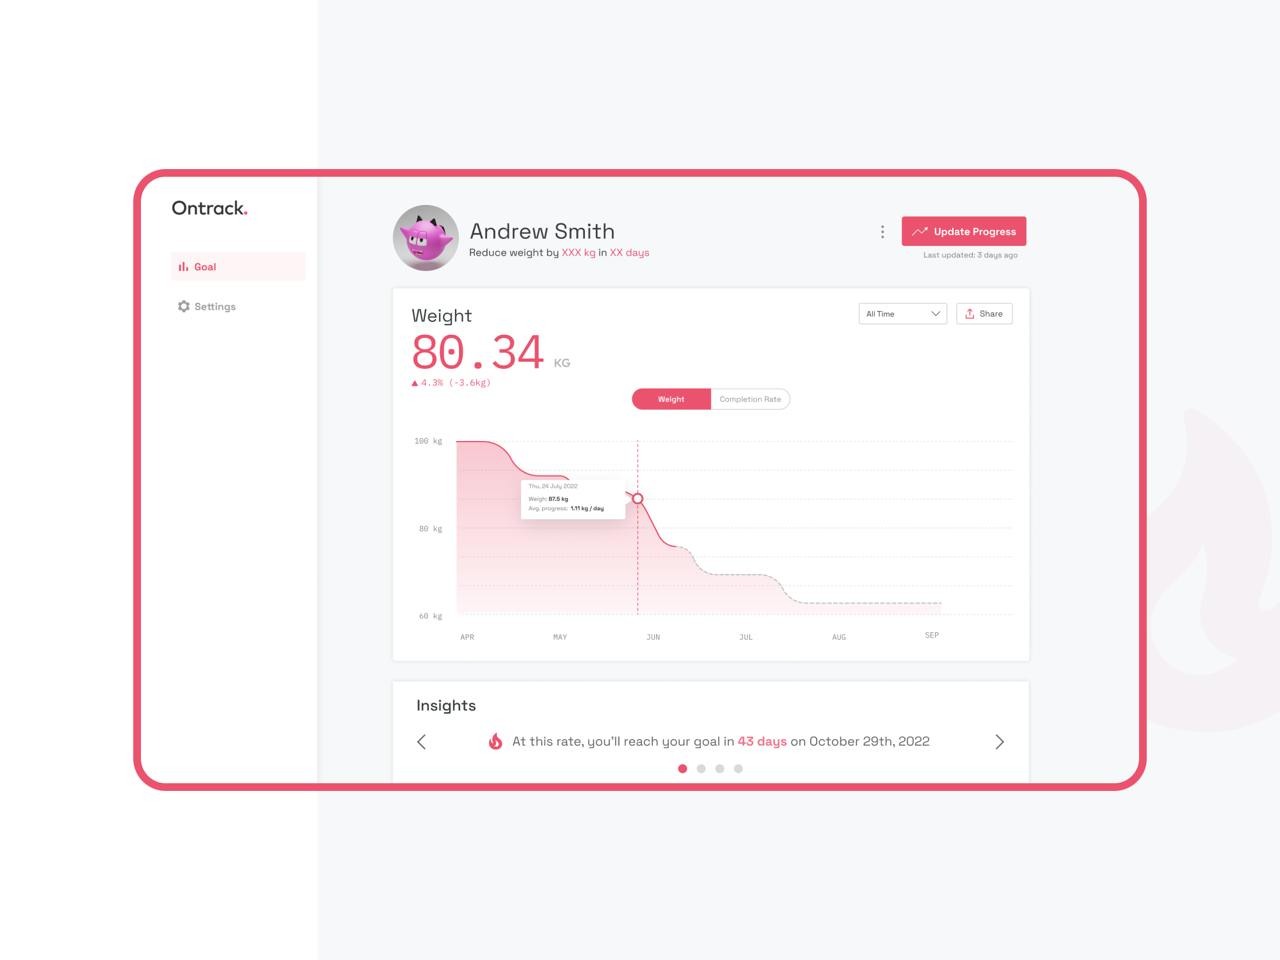
Відкрити сценуWeight timeline chart, progress %, and insight: reach goal in 43 days
Досьє проєкту
People set a goal, log their progress, and instantly see if they are on track, and exactly when they will arrive.
Next.js + React frontend, Node.js API, Material UI, timeline charting, projection logic, and social auth.
- Термін
- 5 weeks
- Поверхня
- Fitness tracking app
- Статус
- 2025 · Відвантажено
Зведення збірки
- Обсяг
- A fitness web app where users set a weight goal and check whether they are on track to meet it, with a progress timeline chart, a date-based projection, an editable progress log, KPI settings, and the ability to share results.
- Результат
- Users see at a glance whether they will hit their goal and by when, turning a spreadsheet habit into a guided, motivating tracker.
- Складність
- Turning raw weigh-ins into a clean timeline with a believable goal-date projection and a friction-free way to log progress.
Що я робив
- 01Frontend
- 02Charts
- 03Progress logging
- 04Goal logic
Карта стека
Фронтенд
Next.js/React/Material UI
Бекенд
Node.js/Express
Продукт
Timeline/Projection/Progress log